Web-based search tool filtering recipes online based on 14 allergen groups.
Project Management Tools – The Visual Tools
As the main subject of this research project is the Information Age and Information Overload caused by the expansion of the Internet, social media and Big Data, finding the right tools to help design and manage a project seems very relevant.
Any research project requires a considerate and careful planning process to be successful. There is a wide range of tools and literature on design and management methodologies – from basic approaches to more complex strategies, all created to give clear guidance and support with the design process, performance and evaluation.
In my search for the right tools that, I hope, can help me focus and lead on a rewarding journey to a successful outcome, I came across many traditional and widely used tools, such as academic databases like GoogleScholar or PubMed, writing and citation assistants, including Grammarly, CiteMe or Microsoft Word writing assistant, as well as some new and AI powered tools, such as Evernote, Bit.ai or Semantic Scholar. I sifted through strings of websites offering powerful tools to help design and organise the whole research process, and an endless list of mobile applications promising ultimate solutions to clutter and confusion, only to find even more confusion.
An intention to briefly research, test and evaluate the most appropriate tools tailored to my own project has led me to an interesting journey, culminating in an insight into my own thinking process and, yet again, a realisation about the power of my ‘skill’ to get sidetracked and distracted from my own goals. In this journey, I read about the Waterfall approach, the SCRUM, timelines, RACI charts, Kanban boards and Gantt Charts, and concluded with around a dozen accounts that promised ‘great solutions to clutter’ and free access, to only find them overly complex, muddled and confusing, or ‘free’ – yes, however, for one day only! However, this wasn’t as wasted a journey as it seemed. I came full circle to realise, once again, that the key to (my) success is to keep the project as simple as possible and not to ‘over-design’ and ‘over-manage’ the project, where the ‘over-design’ relates to using too many tools and losing track of ‘what is where’, and the ‘over-management’ relates to allowing for flexibility and error margin, as this is also an important step of any research project.
The conclusion of this exercise, therefore, is to use some basic tools for referencing and citing, a simple timeline design to keep track of the project’s progress and a simple ‘To do’ list to record milestones and keep motivated.
The project management tools that seemed to capture my attention were the Gantt Chart and Kanban Board for their simplicity and visual appeal.
A Gantt Chart can be described as a chart with horizontal bars visualising the start and end dates of a task displayed on a timeline. By using these bars, the project can be measured into manageable chunks, with an added bonus of displaying the single task and the overall project’s progress, as pictured below (ampler.io, 2025):
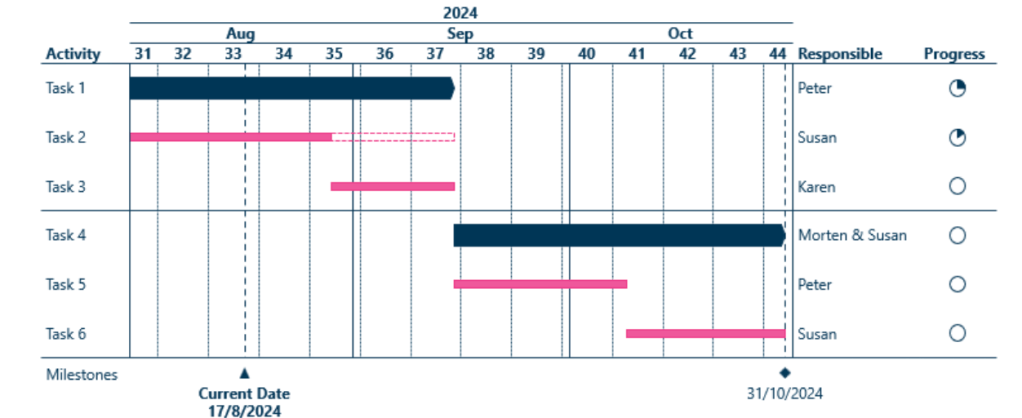
I have found the Gantt Chart visually appealing, and I could easily tailor it to fit my own research project, however, there are some disadvantages of this chart to keep in mind:
- Requires regular updates, which can add to the workload,
- Gantt Charts can be less effective for creative and agile projects that require more flexibility,
- The focus on deadlines can lead to quality compromise.
Kanban Board, on the other hand, is a visual board to represent workflow with the help of individual cards placed within columns of different project stages, usually named as ‘To Do’, ‘In Progress’ and ‘Completed’. The cards display individual tasks, including descriptions and relevant details, as pictured below (ampler.io, 2025):
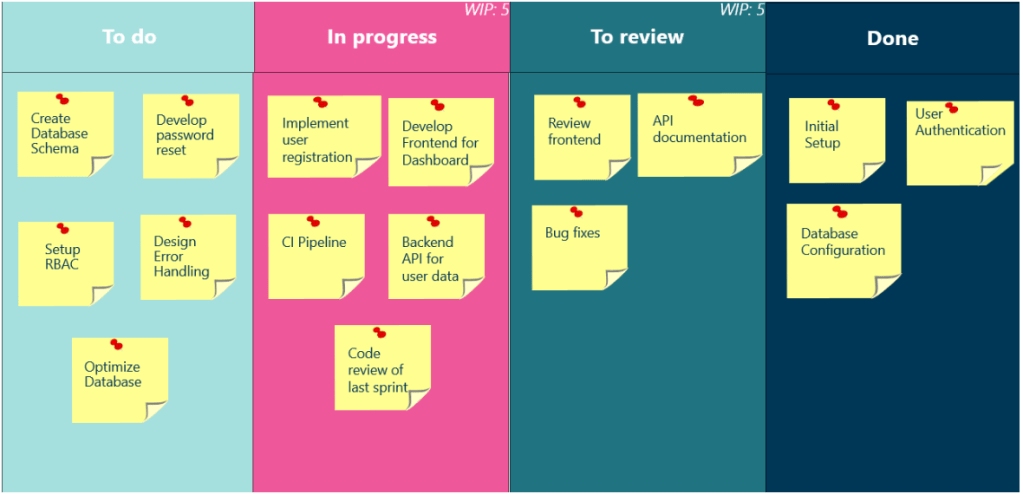
While Gantt Charts provide a detailed plan and some flexibility to a project’s timeline, the Kanban Board allows for greater adaptability and enables better team collaboration and adaptation to obstacles.
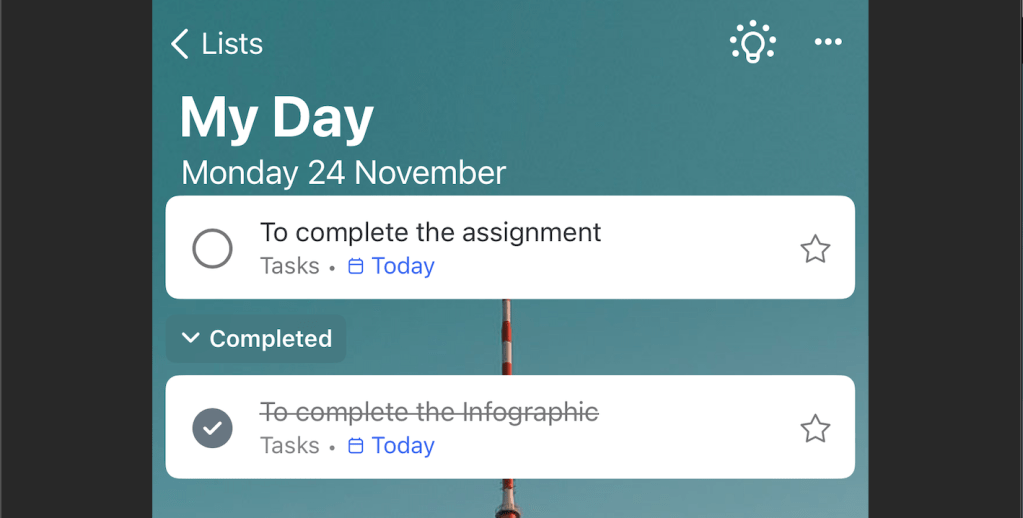
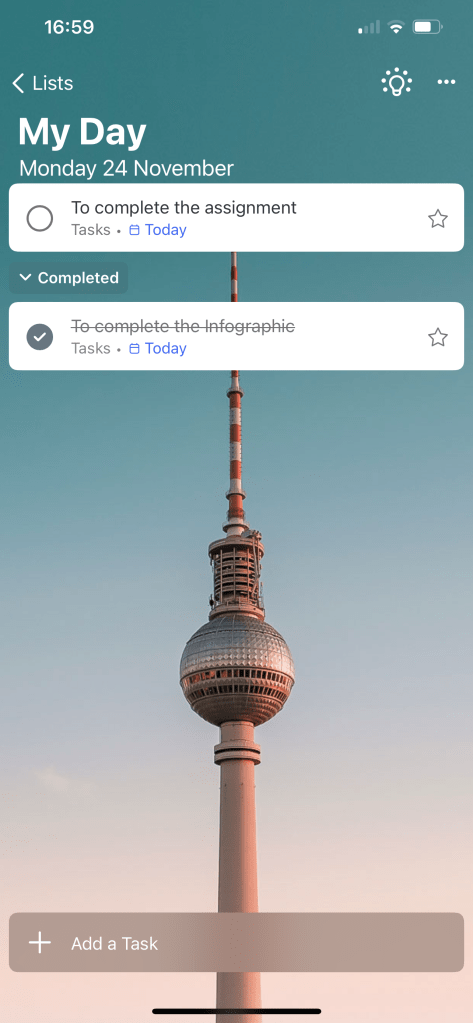
I looked at various Gantt Chart and Kanban Board samples, ready-made templates and interactive interfaces that allow interactive editing; however, I found them overcomplicated and too distracting. Therefore, the final decision was made to use a simple Gantt Chart template (in free Canva version) and tailor it to my project, and a simple ‘To Do’ list of tasks – I will be using Microsoft Word free ‘To Do’ mobile application, with a clear interface, showing ‘To Do’ tasks, displayed in lists divided into ‘My Day’ or ‘Planned’ and which allows for a simple tick option once the task is completed. I have found this way of displaying tasks much easier to organise, and without an extra layer of visibility of all due tasks, which can be overwhelming, as pictured below:
Reference:
ampler.io (2025) Step-by-Step Guide to Creating Gorgeous Gantt Charts [online] Available from: https://ampler.io/articles/step-by-step-guide-to-creating-gorgeous-gantt-charts/ [Accessed: 20 November 2025]

Leave a comment