• My Research – Project Plan and Management

    Web-based search tool filtering recipes online based on 14 allergen groups.

    For the project to be successful, the following methodology and key steps will be undertaken:

    1. Define the scope:

      The Scope of this project is to design, develop, test and evaluate a prototype web-based search tool that allows for the identification and filtering of online recipes based on fourteen allergen groups defined by the UK and EU legislation.

      The tool will:

      • utilise web scraping to find , collect and extract key recipe data from selected websites and open source datasets.
      • use text processing methods to identify allergens,
      • store the processed data in a structured database,
      • allow users to filter out unwanted allergens from recipes through interactive faceted search filters.

      2. Define clear objectives:

      • Research on existing recipe search platforms and faceted search, allergen awareness and existing allergen labelling practices, web scraping methods, web-based systems and user interface for users with dietary restrictions, and ethical and legal aspects of web scraping and designing interfaces within health-related environments.
      • Develop a web scraping system to find and extract recipe data from ethical sources available online.
      • Implement data preprocessing, cleaning and tokenisation for recipe standardisation.
      • Design and implement an allergen detection system based on keyword text analysis and matching.
      • Build a structured database to store scraped and processed recipe data.
      • Develop web web-based user-friendly interface that allows for faceted search filtering.
      • Test and evaluate the search tool for usability, functionality, accuracy, accessibility and user trust.
      • Discuss ethical and legal aspects in relation to ethical web scraping, data collection, use and storage, and ensuring compliance with ‘robot.txt’ files and websites’ terms and conditions as well as data protection legislation.

        3. Design the evaluation approach to assess the progress, effectiveness and the quality of the final product:

        • Considering usability and performance assessment, a mixed-methods usability evaluation approach will align with the aim of the project and give strong evidence,
        • This approach will combine quantitative evaluation of usability based on performance, including:
          – Error rate,
          – task success rate,
          – task completion time,
          – SUS score.
          These metrics are statistically significant and will give strong objective evidence of the effectiveness of the tool,
        • With a Qualitative usability evaluation based on data collected from user feedback by employing:
          – interviews,
          – open-ended questionnaire,
          – observations while using the tool.
          This data provides another layer of depth to the qualitative findings and will help with understanding ‘why’ the tool is working or will reveal any issues with usability.
        • Comparative evaluation – the evaluation metrics of the web scraping enhanced tool will be compared with a baseline condition, such as a standard recipe search. The metrics used in this approach include:
          – accuracy,
          – speed,
          – satisfaction and confidence,
          – allergen detection success rate.

        4. Collect the data – gather all relevant data using above methods.

        5. Analyse the results by processing the collected data by utilising statistical analysis, comparative metrics and user evaluation insights.

        6. Report the findings and reflect on success rate and any issues, and future improvements.

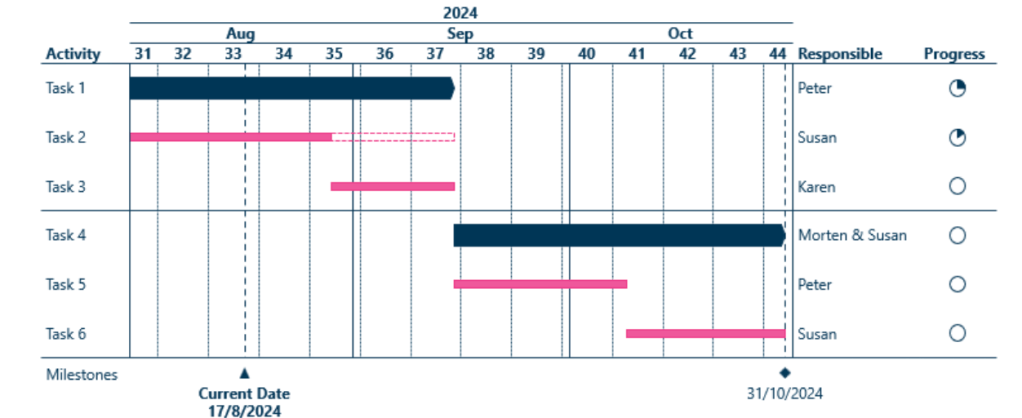
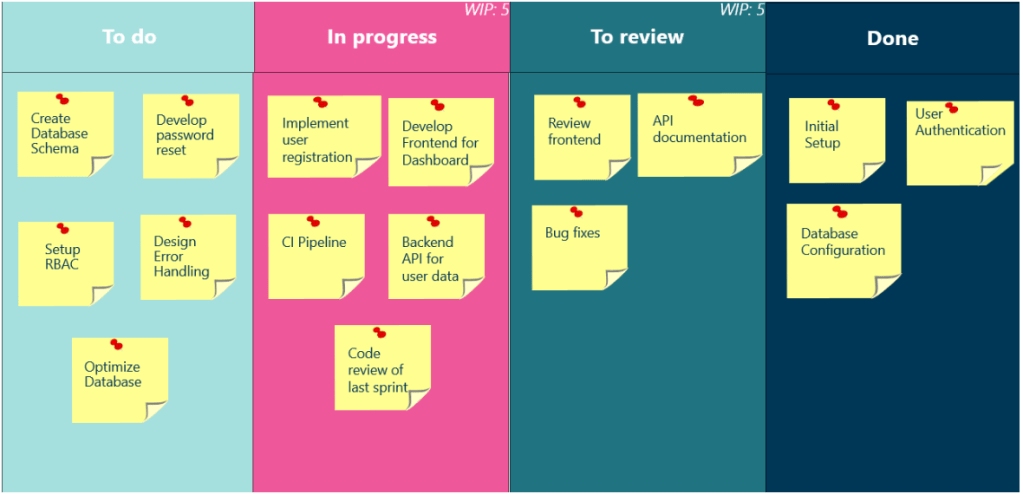
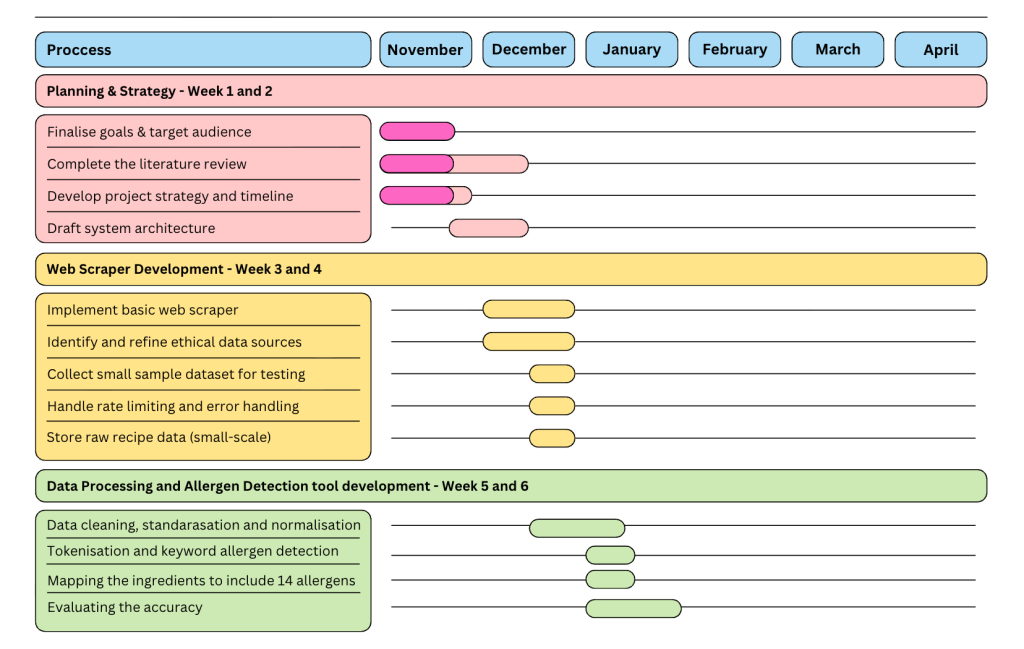
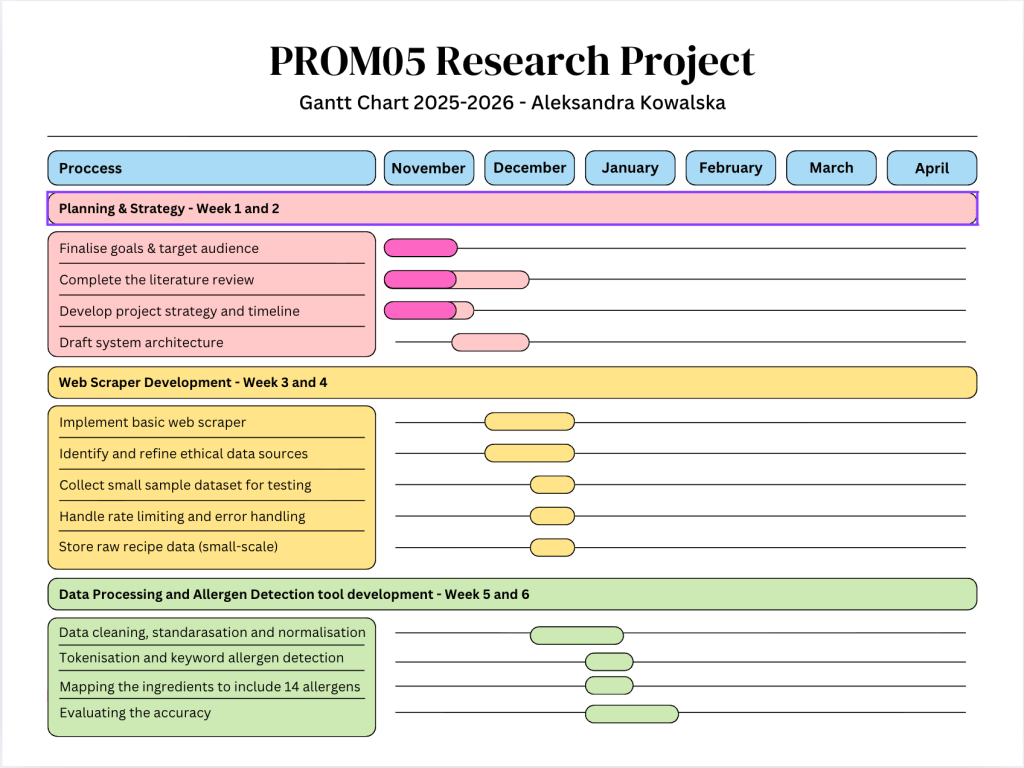
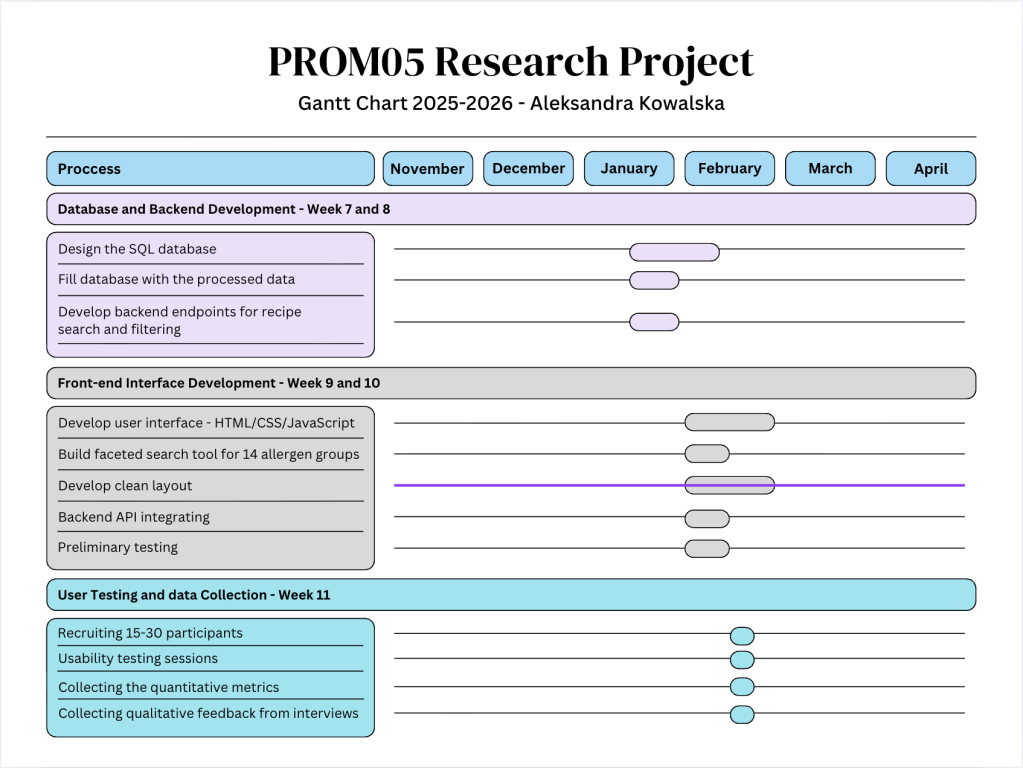
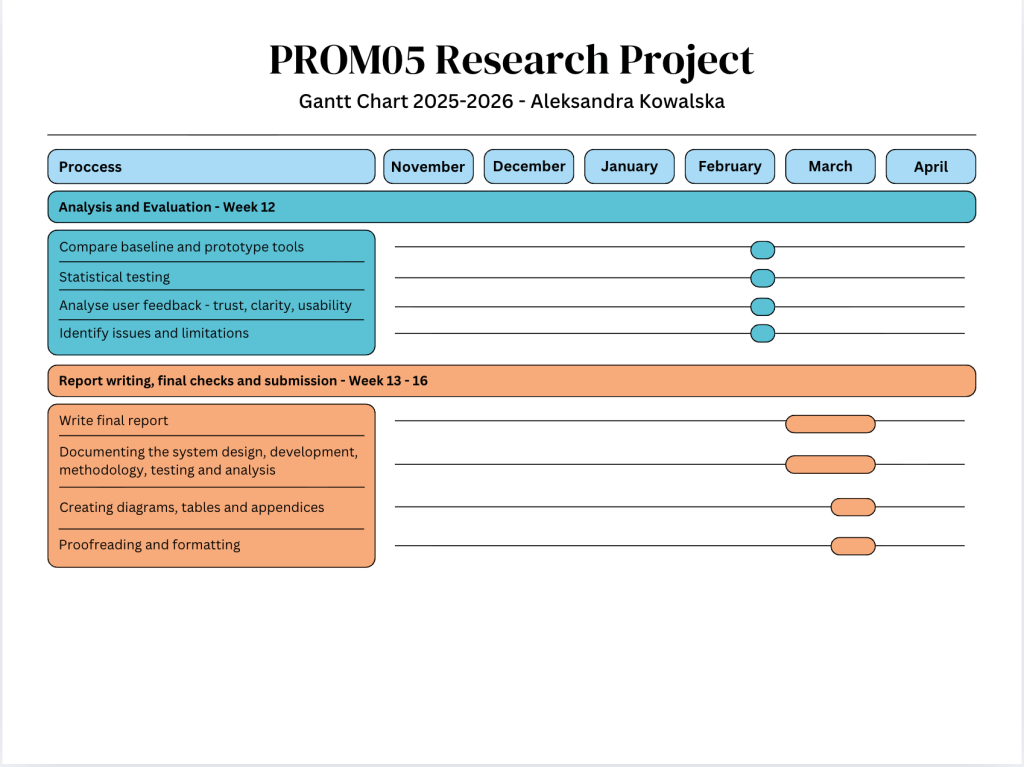
        The following Gantt Chart shows an initial timeline to help with the project management and to monitor the progress:

          References:

          Strba, M. (2025) Evaluation Research Methods [online] Available from: https://www.uxtweak.com/evaluation-research/methods/ [Accessed: 22 November 2025]

        1. My Research – Choosing the right data

          To support this research project, a wide range of qualitative and quantitative data types can be utilised using a qualitative, quantitative or mixed-method approach (Urban, JB, & van EBM, 2017).

          Qualitative Data is any descriptive data that deals with actual words, stories, pictures or videos, and gives an extra depth and user insight. This could be:

          • user interviews,
          • surveys,
          • user feedback,
          • observations of users and their behaviour during any testing stages.

          This type of data complements quantitative data and helps explain ‘how’ and ‘why’ the tool works by capturing both experiential and cognitive aspects.

          Quantitative Data is any numerical and measurable data, such as weight or rankings on a scale. This type of data allows for objective evidence of performance and statistical tests and includes:

          • Task success rate,
          • Error rate,
          • Task completion time,
          • System Usability Scale score – SUS.

          Considering the nature and technical aspects of the web-based search tool being developed in this project, the mixed-method approach is the most appropriate.

          This approach will provide strong statistical evidence supported by user experience insights
          and a deeper understanding of the performance of the algorithms used in the tool. The most accurate combination of data types is as follows:

          Primary Data to support the tool’s performance during all stages of development:

          1. Quantitative Data for efficiency and usability scores, including task completion time, Task success rate, error rate, System Usability Scale, and number of recipes retrieved during each search session.
          2. Textual data for processing and storage in a database, including titles of recipes, lists of ingredients, instructions and keywords for allergen classification.
          3. Qualitative Data for user experience analysis and insight, including user interviews, surveys, and observations on click patterns, errors in navigation, or user-hesitation or confusion patterns during usability testing.

          Secondary Data to give an understanding of existing search tools, highlight the areas of focus, any issues that require improvement and identify potential risks:

          1. Pre-existing qualitative data collected during the literature review on existing web-based search tools for recipe finding interface and their performance, user satisfaction and trust, and compliance with Food Information Regulation and labelling practices.
          2. Pre-existing quantitative data from market research and publications on usability and efficiency statistics for existing recipe search tools.

          As well as the above data types, the following data will be produced during the development of the tool:

          • The Textual Data – all recipe titles, instructions and ingredient lists collected by web-scraping and stored in a database, used primarily for algorithmic processing in the classification and allergen detection.
          • The Processed Data – data generated from the Raw data by cleaning and normalisation, such as allergen classification and recipe categorisation.
          • The Metadata – structured data to describe the main collected data and enhance the organisation, discovery, and data quality management (Lu, 2024), such as the source of the website, URLs, data and time of scraping, type of cuisine etc, used for faceted search filtering and for analysis.
          • The data generated by the system – any scraped recipes logs, errors, search query metadata.
          • The data collected from usability testing, such as the click patterns, errors or patterns in user behaviour – helpful in refining the UI/UX.

          References:

          Lu, T. (2024) What is Metadata? A Guide to Understanding Data About Data [online] Available from: https://www.datacamp.com/blog/what-is-metadata?utm_cid=19589720821&utm_aid=186331391909&utm_campaign=230119_1-ps-other~dsa~tofu_2-b2c_3-emea_4-prc_5-na_6-na_7-le_8-pdsh-go_9-nb-e_10-na_11-na&utm_loc=9045798-&utm_mtd=-c&utm_kw=&utm_source=google&utm_medium=paid_search&utm_content=ps-other~emea-en~dsa~tofu~blog~data-governance&gad_source=1&gad_campaignid=19589720821&gbraid=0AAAAADQ9WsEQdQdAPhoaaVNxHDuPlABdt&gclid=Cj0KCQiAoZDJBhC0ARIsAERP-F_mh2MmSN8jrTjDW2HSweB2GQGKh6oxv9ln5weZb491pWstaLwZYdcaAn9vEALw_wcB [Accessed: 21 November 2025]

          Urban, JB, & van, EBM 2017, Designing and Proposing Your Research Project, American Psychological Association, Washington, D. C.. Available from: ProQuest Ebook Central. [Accessed: 20 November 2025].

        2. My Research – Choosing the right tools

          Web-based search tool filtering recipes online based on 14 allergen groups.

          Any research project requires a considerate and careful planning process to be successful. There is a wide range of tools and literature on design and management methodologies – from basic approaches to more complex strategies, all created to give clear guidance and support with the design process, performance and evaluation.

          In my search for the right tools that, I hope, can help me focus and lead on a rewarding journey to a successful outcome, I came across many traditional and widely used tools, such as academic databases like GoogleScholar or PubMed, writing and citation assistants, including Grammarly, CiteMe or Microsoft Word writing assistant, as well as some new and AI powered tools, such as Evernote, Bit.ai or Semantic Scholar. I sifted through strings of websites offering powerful tools to help design and organise the whole research process, and an endless list of mobile applications promising ultimate solutions to clutter and confusion, only to find even more confusion.

          An intention to briefly research, test and evaluate the most appropriate tools tailored to my own project has led me to an interesting journey, culminating in an insight into my own thinking process and, yet again, a realisation about the power of my ‘skill’ to get sidetracked and distracted from my own goals. In this journey, I read about the Waterfall approach, the SCRUM, timelines, RACI charts, Kanban boards and Gantt Charts, and concluded with around a dozen accounts that promised ‘great solutions to clutter’ and free access, to only find them overly complex, muddled and confusing, or ‘free’ – yes, however, for one day only! However, this wasn’t as wasted a journey as it seemed. I came full circle to realise, once again, that the key to (my) success is to keep the project as simple as possible and not to ‘over-design’ and ‘over-manage’ the project, where the ‘over-design’ relates to using too many tools and losing track of ‘what is where’, and the ‘over-management’ relates to allowing for flexibility and error margin, as this is also an important step of any research project.

          The conclusion of this exercise, therefore, is to use some basic tools for referencing and citing, a simple timeline design to keep track of the project’s progress and a simple ‘To do’ list to record milestones and keep motivated.

          The project management tools that seemed to capture my attention were the Gantt Chart and Kanban Board for their simplicity and visual appeal.

          A Gantt Chart can be described as a chart with horizontal bars visualising the start and end dates of a task displayed on a timeline. By using these bars, the project can be measured into manageable chunks, with an added bonus of displaying the single task and the overall project’s progress, as pictured below (ampler.io, 2025):

          I have found the Gantt Chart visually appealing, and I could easily tailor it to fit my own research project, however, there are some disadvantages of this chart to keep in mind:

          • Requires regular updates, which can add to the workload,
          • Gantt Charts can be less effective for creative and agile projects that require more flexibility,
          • The focus on deadlines can lead to quality compromise.

          Kanban Board, on the other hand, is a visual board to represent workflow with the help of individual cards placed within columns of different project stages, usually named as ‘To Do’, ‘In Progress’ and ‘Completed’. The cards display individual tasks, including descriptions and relevant details, as pictured below (ampler.io, 2025):

          While Gantt Charts provide a detailed plan and some flexibility to a project’s timeline, the Kanban Board allows for greater adaptability and enables better team collaboration and adaptation to obstacles.

          I looked at various Gantt Chart and Kanban Board samples, ready-made templates and interactive interfaces that allow interactive editing; however, I found them overcomplicated and too distracting. Therefore, the final decision was made to use a simple Gantt Chart template (in free Canva version) and tailor it to my project, and a simple ‘To Do’ list of tasks – I will be using Microsoft Word free ‘To Do’ mobile application, with a clear interface, showing ‘To Do’ tasks, displayed in lists divided into ‘My Day’ or ‘Planned’ and which allows for a simple tick option once the task is completed. I have found this way of displaying tasks much easier to organise, and without an extra layer of visibility of all due tasks, which can be overwhelming, as pictured below:

          Reference:

        3. PROM05 My Research

          The aim of this project is to design, develop, launch, test, and evaluate a web-based search tool capable of analysing and filtering online recipes according to the fourteen legally recognised allergen groups. By employing an automated system based on ethical web scraping techniques, the proposed tool will enable users to effortlessly locate recipes that align with their dietary restrictions. The final design will focus on being user-friendly, intuitive, and visually clear, ensuring an accessible experience, free from unnecessary distractions or interface clutter.

          The subject:

          The focus of the study is on the Information Age and Big Data, specifically examining Data Automation and Information Overload, with particular emphasis on how Information Overload affects user experience in terms of search efficiency, perceived usability, trust and transparency. In relation to this, the online search process and the faceted search will be investigated as an effective solution to tackle Information Overload.

          In addition to the above, the study will also address allergen awareness and provide a basic overview of online recipe search tools already in use, as well as their compliance with providing allergen information and labelling practices.

          For the search tool to be effective, automation techniques will be employed during development, including web scraping, data collection methods, data clustering and automated ingredient detection, as well as dynamic search filtering. Therefore, research into these methods will be performed, as well as web interface design for users with dietary restrictions.

          Research questions: 

          1. Is there a need for an enhanced search tool to detect allergens in recipes available online?

          2. Why is searching for recipes online often frustrating for users with specific dietary restrictions?

          3. What is web scraping, and under what circumstances can it be considered unethical?

          4. How can the ethical implementation of web scraping techniques within faceted search systems enhance user experience while ensuring data privacy and compliance with digital ethics standards?

          To achieve the above aim and answer the research questions, the following objectives and methodological stages will be employed in the form of a mixed-methods study combining a prototype implementation and user evaluation:

          1. Literature review – exploring the context of food allergy awareness and labelling standards, big data and information overload, the functionality and limitations of existing recipe filtering and faceted search systems, and relevant web scraping techniques, data collection methods, text analysis processes, and the design of web-based search systems and user interfaces.
          2. System Design and Architecture – designing and developing three-layer architecture that will consist of Data Layer, Application Layer and Presentation Layer.
          3. Data collecting and Web Scraping from ethical sources.
          4. Data pre-processing and cleaning such as tokenisation, normalisation and ingredient mapping.
          5. Allergen detection – developing classification and filtering component usin keyword matching and text analysis techniques.
          6. Database development – creating a structured database using PostgreSQL.
          7. Web Application development – developing an interactive and user-friendly web tool focusing on faceted search capabilities.
          8. Testing and evaluating – employing techniques such as baseline comparison of functionality of the traditional search and web scraping enhanced tool, usability and satisfaction levels testing by conducting participant interviews/surveys, quantitive evaluation such as System Usability Scale or Task Success Rate, and data analysis such as Paired T-Test or Wilcoxon Signed-Rank Test.
          9. Ethical, Legal and Technical considerations – identifying potential technical challenges and evaluating the legal, professional, and ethical implications of using web scraping. Emphasis will be placed on compliance with website terms and conditions, data protection legislation, and ethical safeguards ensuring responsible data collection and system deployment.

          Resources and constraints:

          Hardware – standard PC able to run Python-based applications and Visual Studio, minimum 100GB of storage for the web-scraped data, as well as a cloud-based platform to host the prototype (such as Render or PythonAnywhere).

          Software – Python and tools and libraries such as BeautifulSoup and Scrapy for web scraping, Pandas for data collection and cleaning, Django and Flask for back-end development, HTML, CSS and JavaScript for front-end development, MySQL for the data storage, as well as PyTest for code functionality testing and GitHub for version control.

          Data Sources – all data will be collected from open-source data sets, publicly available sources and websites that allow web-scraping.

          Human resources – for usability testing and evaluation, a group of 15-20 participants from a range of backgrounds will be employed.

          Constraints – following limitations and constraints will be addressed in this study:

          • time limitations,
          • scope of available resources,
          • variability of the data,
          • Inconsistent allergen labelling,
          • storage limitations,
          • legal and ethical standards.

          Reference:

          Kowalska, A. (2025) Research Project Proposal: Assignment 2. Prom04: Research Project Proposal. University of Sunderland. Unpublished assignment.